|
Opening a New Trade
When we open a new trade it is a thoughtful process of weighing the risks vs. rewards
and the probability of a successful outcome. We study the charts for familiar patterns
and seek secondary confirmation from other sources of information.
In the previous example of predicting the future actions of a person walking down the street, we want
to look for patterns that repeat. If that person walked into a restaurant at lunch time then we could
predict that he would remain in that establishment and eat for 30-60 minutes. He might just use the
bathroom and take only 10 minutes, but at least 60% of the time he will eat, so we have a good trade
on that information. There are many other similar patterns like playing sports, going to work, etc.
that we could eventually define that would give us good predictive value. In the same manner we look
for patterns in the market that will give us short term information on what the market will do next.
|
|
Where to look for Patterns
There are three places to look for patterns: 1) In the raw price action itself, 2) At derivatives of the
raw price action, and 3) In indicators that have the price action as an input.
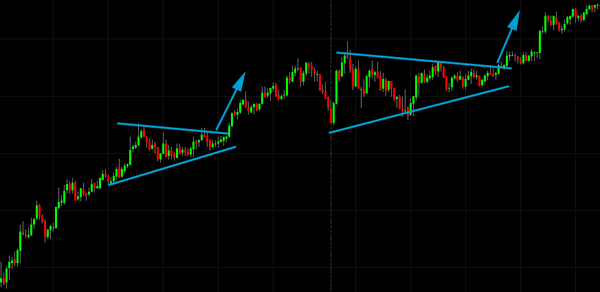
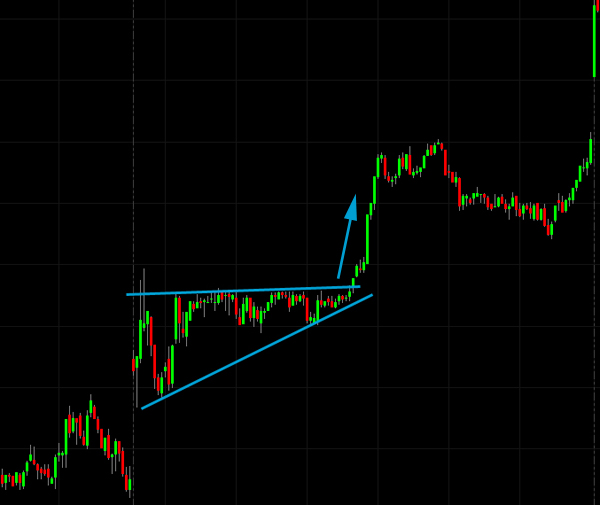
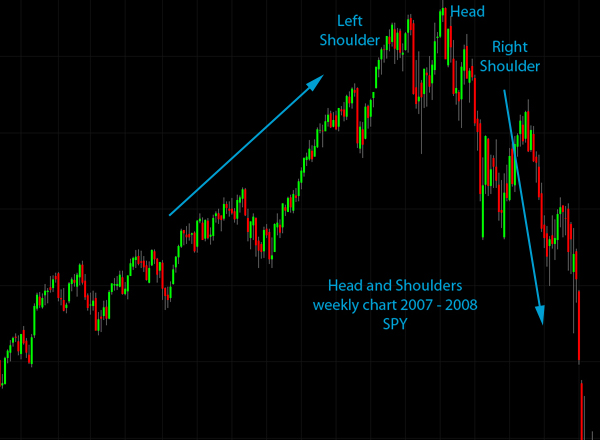
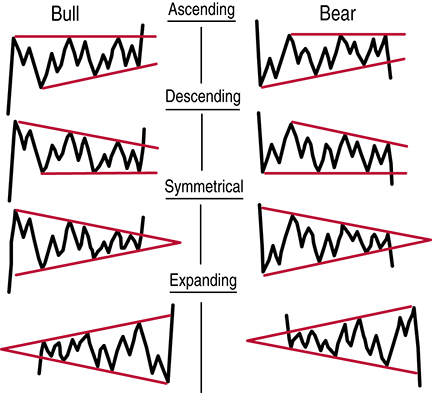
The Raw Price Action
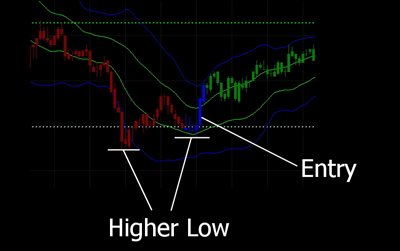
The following bullish patterns use the raw price action in that the charts have not had their appearance
altered and we are not relying on any indicators. These are reversed for bearish trades. The picture at
the top right of this page is an example of the use of higher lows off of a support level. The pictures
below represent examples of some common patterns. There are whole books written on them so we won't
cover them in detail here but I am showing you my favorites.
|
|
These types of patterns are little gold mines when they occur, but we will need more ways to
trade because you may not see them often enough each week. The chart at the right shows the
most frequently occurring intra-day and daily patterns.
If you trade stocks then you will see these patterns more often due to the large number of
stocks to pick from, but you will need to do a lot of looking each day.
I am going to look at support and resistance patterns separately on the next page. We will also look at
some candlestick patterns.
|
 |
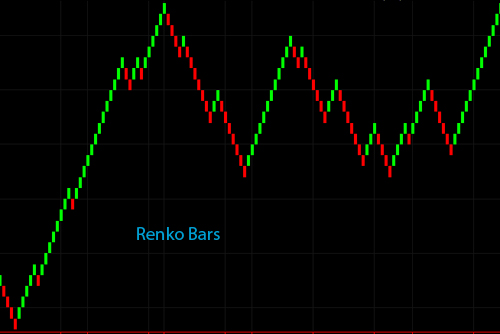
Derivatives of Price Action
Renko bars, Range Bars, and P&F charts are often seen as magic tools to trade successfully. This is
mostly because they look great in retrospect. As long as you just look at historical patterns it looks
like easy money. In real time trading it is not so clear and traders are often no more successful than they
were with regular charts. Day traders often use tick volume bars, which is a good alternative to time based
bars (the bars look like regular bars but they are based on trade volume not time).
I have seen people refuse to entertain anything other than a range bar chart because they were convinced
that these charts held the secret to success and everything else was inferior, but they could not get them
to work. It is usually just a mirage but some people are successful with them.
If someone is praising the virtue of a funky looking chart, always ask him how much money he is making with
it. I had to look through a lot of charts to get one that looks as clean as the one on the right. The rest of
the charts looked pretty untradeable.
|
 |
|
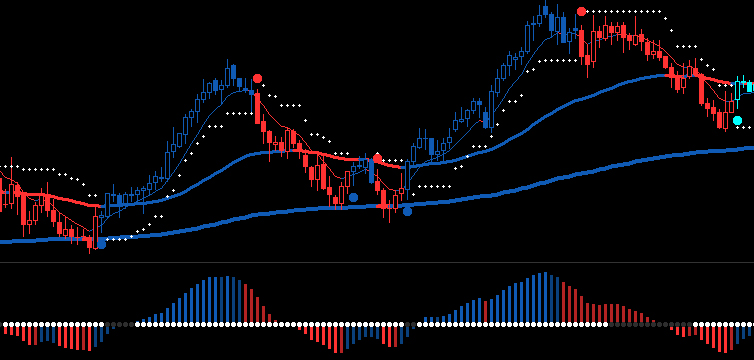
Indicators
Indicators are a way of smoothing out the price action or to mathematically evaluate it. Indicators can remove the
short term noise to see the underlying trend. They can also be used to establish rules that will keep your trading
consistent. For example. you could use two moving average lines and only buy when the faster moving average is
above the slower one and only sell when the faster moving average is below the slower one. If it helps you to be
consistent then it can make you more profitable by giving you consistent action points. The below indicator set is
an example of a number of similar packages that can help you make better choices.
|
 |
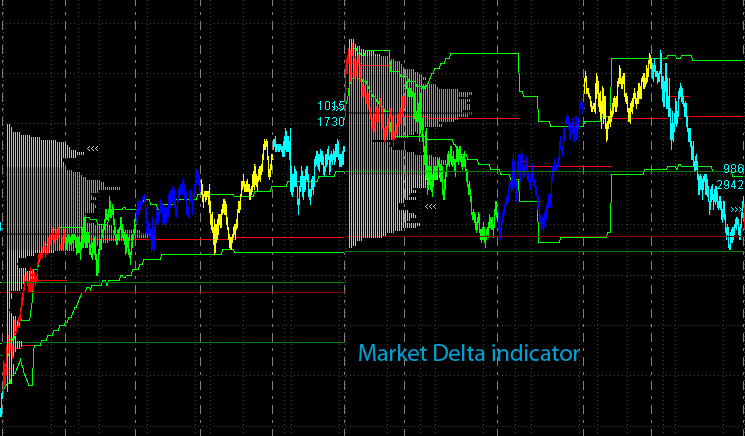
| This type of indicator will require much more training to use: |
 |
Scott Tafel is the founder and principle partner in Falcon Trading Systems: computers for traders. He has
been a trader since 1999. Mr. Tafel spent 27 years working in the Nuclear power industry, principally as a
Nuclear Reactor Operator.
|
|
|