|
Stock Trading how to: Using advanced indicators in Technical Analysis
I would consider moving averages, MACD and volume to be basic indicators that I cover elsewhere. Here I would like to focus on
much more abstract indicators. The first indicator class that is
one that use Standard Deviation, which is part of probability theory. Standard deviation, or "σ" (sigma), is how "abnormal" something is.
For example, there is less than a .5% chance that the price of the market will be more than 3 standard deviations away from the mean price value. However,
the reliability of the result is not that high because it is a time series of values,
which is an invalid way to use Standard Deviation. However, we can still use it to consistently
measure how unusual something is and estimate what that means to us in trading.
The most important indicator that uses Standard Deviation
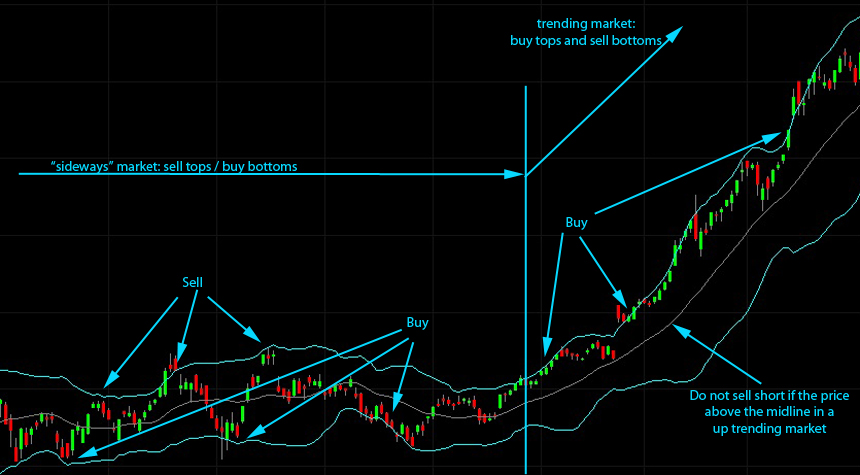
are the Bollinger Bands. In a sideways (or "consolidating") markets you sell the market
when it reaches the upper band and buy it when it reaches the lower band. In a trending market you do exactly the opposite, as illustrated below.
The below daily chart of AAPL uses the usual value of "2" for the standard deviation
and a length of 20 for the moving average (center line).
The larger the value of the centerline moving
average then the more obvious it will be when you
are in a trending market but it will also be slower
to singnal you when the trend is over.
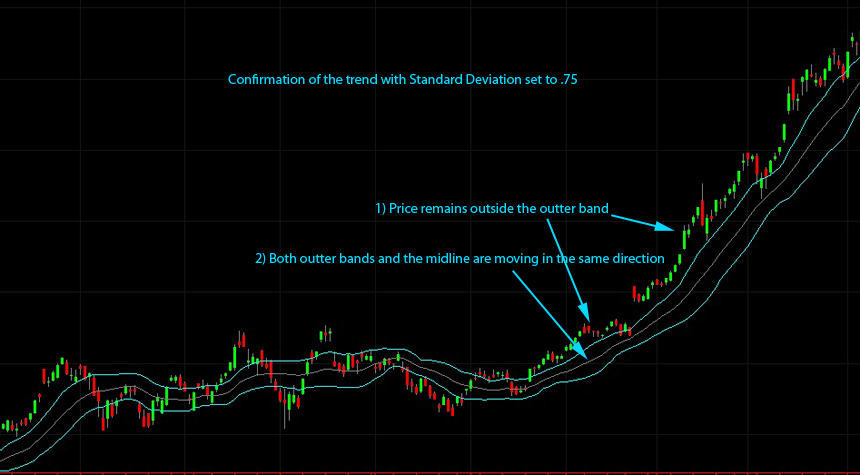
A secondary use of standard deviation is to help confirm the trend. If you set the Bollinger Band Standard Deviation value to .75 then whenever the price action is
firmly outside the outter bands and all three of the bands are pointing firmly in the same direction then the market is trending. If at some point
the price action crosses to the other side then the trend is broken.
Oscillators
There are too many oscillators out there for us to cover in depth here but there are two that that are frequently used by traders:
The Stochastic Oscillator and the McClellan Oscillator.
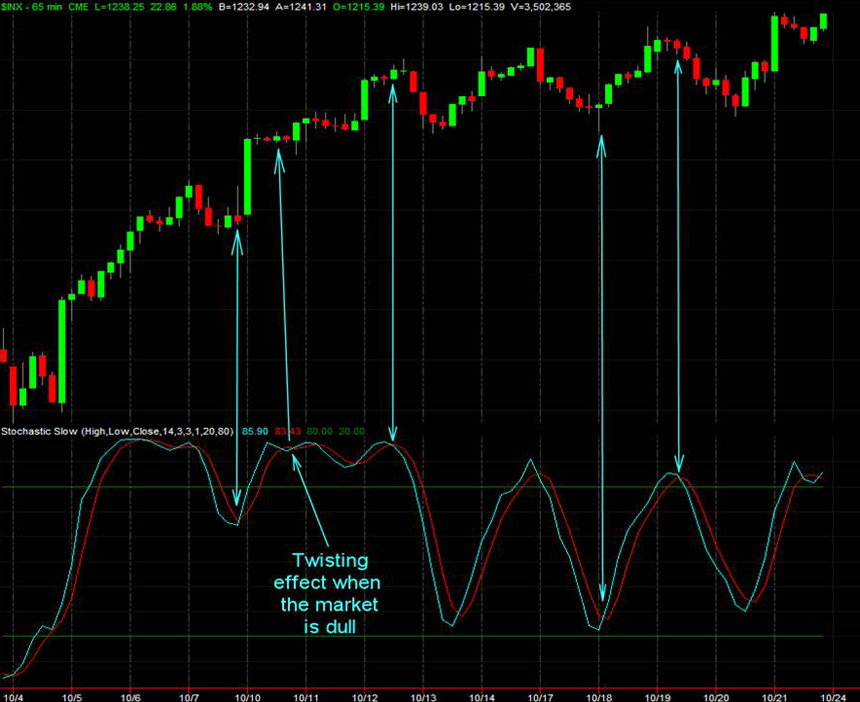
The Stochastic Oscillator is a momentum indicator that uses support and resistance levels on a secondary scale (see below). When the
two stochastic lines are "twisting" then the signal is less reliable. When the stochastic oscillator is at either extreme then the chance of a reversal is good.
When the stochastic oscillator is trending from one side of the scale to the other then the stock is trending. A great many traders apply the stochastic indicator
to multiple time frames like weekly, daily, hourly, and 15 minute charts
and then wait for all of them to agree.
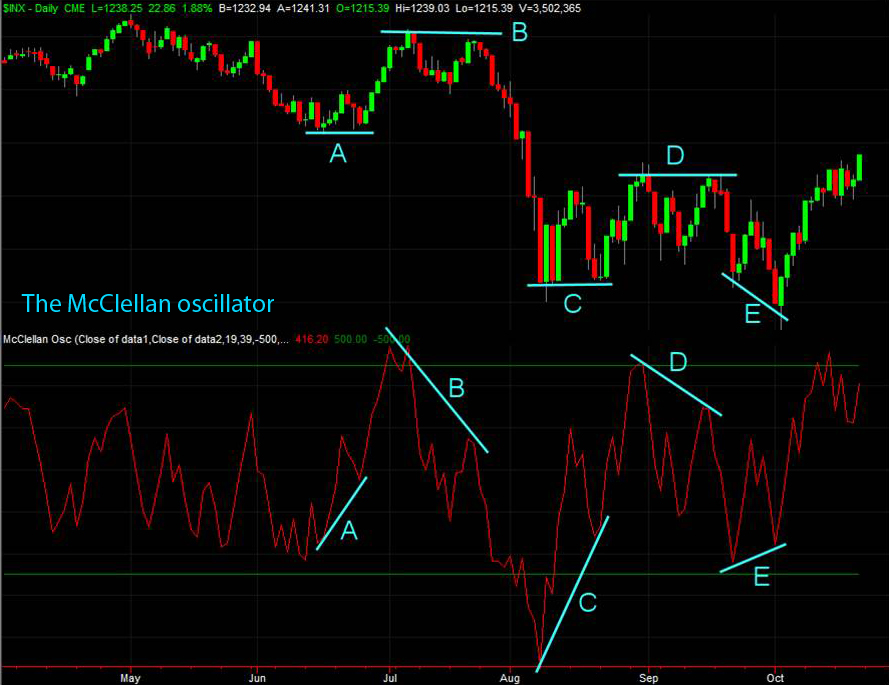
The McClellan oscillator is a market breadth indicator using the exponential moving average (EMA) of the daily ordinal difference of advancing issues
(stocks which gained in value) from declining issues (stocks which fell in value) over 39 trading day and 19 trading day periods. It weighs recent
data higher than older data. First, when the Oscillator is positive, it generally portrays money coming into the market; conversely, when it is negative, it reflects
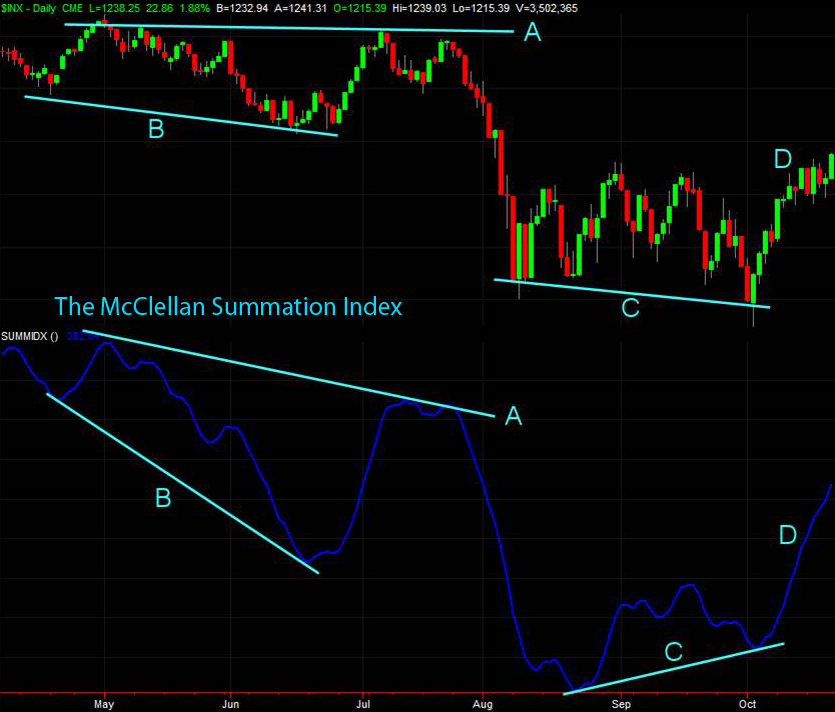
money leaving the market. The McClellan oscillator and its companion indicator the McClellan Summation Index will give you insight into the
strength of a rally or sell off (see the chart below), There are many nuances that can be gained by learning to read these
two indicator. To learn more about using
these indicators get the book Patterns For Profit by Sherman and Marian McClellan, available from McClellan Financial Publications.
The Relative Strength Index (RSI). The RSI is a momentum oscillator, measuring the velocity and magnitude of directional price movements.
It is often used as an "overbought" and "oversold" indicator. This second meaning is useless in that overbought
stocks tend to become more overbought and oversold becomes more oversold. You should not trade against the market or hold back a trade
because of overboughtness or oversoldness. I like the RSI on 10, 15, and 30 minute charts. Use RSI occasionally to confirm that the
market is trending. It is not my favorite indicator and I only use it from time to time.
|